

Report Designer lets you create a wide variety of reports and on the current data available in your data models. If you are working in the Workgroup Edition, you can create Mart administrative reports and cross-model reports. You can create report templates for frequently used reports and you can export reports to HTML, CSV, and PDF formats. You can create report solutions and include multiple report templates.
You cannot reuse the .RTB reports that were created using Report Template Builder, because the metamodel objects are changed. You must recreate the reports in Report Designer.
Several sample (pinned) reports are included with the application and they are available in the following location:
%Installdir%\erwin\Data Modeler r9\BackupFiles\Report Solutions
Also at the following location:
C:\Users\<user name>\AppData\Local\erwin\Data Modeler\r9.7\Report Solutions
Note: The pinned reports are created using a Logical-Physical model. If you use the pinned reports with a Logical-only or a Physical-only model, it may result in inappropriate results.
Follow these steps:
If the current report solution is not saved already, you are prompted to save it. A new blank workspace appears.
The items in the Select Report Subject pane change according to the Report Type that you select.
Note: You must have the Reports: View permission to create Mart reports.
If you are creating a report on your Mart and you have selected an option under Filter By, the Mart Report Filter dialog opens.
The report is generated and displayed. If you do not specify any model or entity, the generated report includes all the models. If you have used a wildcard, by default, the wildcard is applied to all the names. For example, if you type ID, the report includes Cust_ID and ID_For_Category. If the result is very large for Mart reports, the report is displayed in multiple pages (data grid). Use the navigational icons in the toolbar to view the subsequent pages.
Prefixes the object type to only the Name and Physical Name columns. For example, you are generating a report on entities and the corresponding attribute names and data types. The column names in the report are displayed as Entity Name, Attribute Name, and Attribute Logical Data Type.
Prefixes the object type to all columns.
Note: These options work only when they are selected at the time of creating a report. If these options are selected at the time of modifying an existing report, they do not work.
Specifies the number of rows at which the computer resources are optimized to display the report. If the row count in your report exceeds the number that you specify here, the report is displayed in optimization mode. In this mode, the group and sort options are not available in the result grid. If no value is entered, the row count for optimization mode is considered as equal to the total row count of a report.
Specifies the number of top rows that you want to display. This option displays the first few rows that match a report criteria, when the result contains more rows than the number specified here.
Note: When you modify an existing report template and select more properties for the existing report subject, the selections are retained. If you select a different report subject, the previous report subject and its properties are not included in the report.
Specifies the name of the node. By default the name of the selected object is displayed.
Note: These settings apply to both HTML and PDF reports.
Font Family: Specifies the font for the selected node.
Size: Specifies the font size for the selected node.
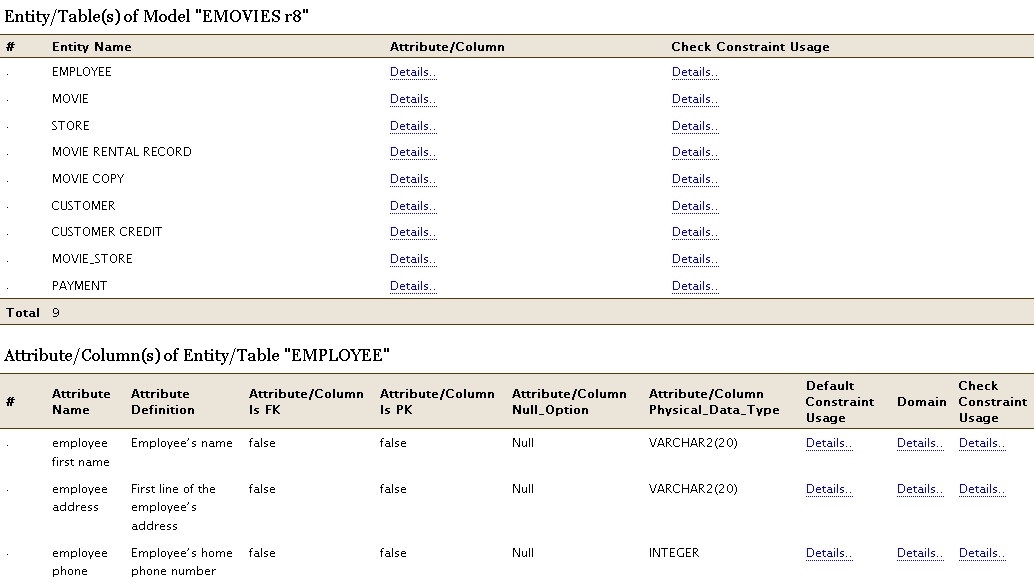
Roll up subtables: Specifies that you want to display a parent and its child node details together. This option is not effective when the report has only one node. The following image illustrates a report without selecting the Roll up subtables option:
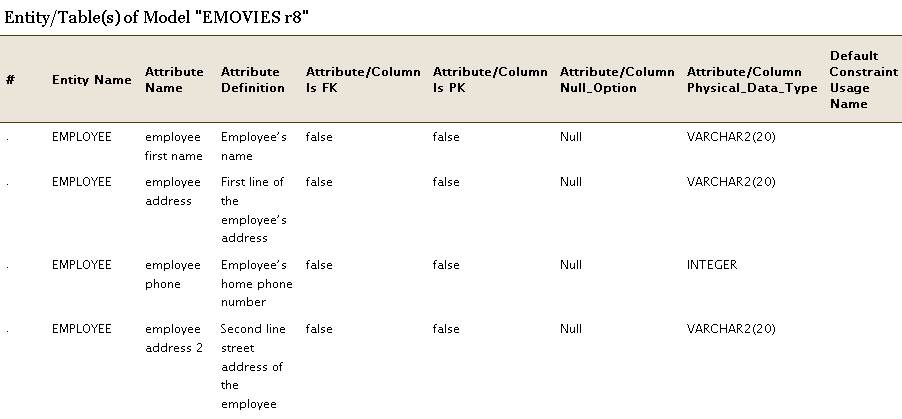
The following image illustrates a report when the Roll up subtables option is selected:
PDF Page Breaking: Specifies that you want to display the details of each node on a new page. The node for which this option is selected and the subsequent nodes are displayed on a new page. This option is not effective when the report has only one node. When the report has multiple nodes, do not set this option on the main node. Suppose your report nodes look like the following illustration:
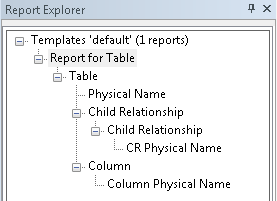
If you apply the PDF Page Breaking option to the Child Relationship (above CR Physical Name) node, the CR Physical Name and Column Physical Name nodes are displayed on a new page.
Foreground: Specifies the text color.
Background: Specifies the background color.
Template Color: Specifies that the color that is specified in the template is used.
Bold/Italic/Underline/Strikeout: Specifies the effect for the text.
Width: Specifies the width of the selected node (report column). You can specify the width for any node and it is applied when the report is exported to HTML or PDF. However, the width is not applied to the last node (last column in the report) in a PDF report. This is because, the remaining length of the fixed page width is considered as the actual width of the column.
Alignment: Specifies the alignment of the text.
This is a best practice and helps the application export the report without consuming much of the computer resources.
Specifies the templates that you want to use with the HTML report. You can use customized templates, provided the formatting is similar to the default templates. The default templates are available in the following folder:
C:\Program Files\erwin\Data Modeler r9\Report\Template\Template-Default
Specifies the title for the entire report solution.
Specifies the text that appears between the report title and the first line of the report.
Specifies the text that appears at the bottom of the report.
\\comp001\erwin\reports\index.htm
Note: The computer from which you are accessing the report must be in the same domain as the one in which the report is published. In addition, the user who is accessing the report must have at least the read-only privileges on the corresponding folder.
Specifies whether you want to include the first-level object names multiple times. For example, you have included entity names and attribute names in your report and you have selected No Duplicates. The entity name appears only once for all the corresponding attribute names. If you have selected Duplicates, the entity name appears as many times as the corresponding attribute names appear.
Specifies the symbol that you want to use to indicate the column headers.
Specifies how you want to separate two columns in the exported report. The option Comma Delimited creates a .CSV file and the remaining options create .TXT files.
This is a best practice and helps the application export the report without consuming much of the computer resources.
Specifies the title for the entire report solution.
Specifies the text that appears on the first line of every page of the report.
Specifies the text that appears at the bottom of every page of the report.
For each of these options, you can specify the font, size, color, and alignment.
Specifies the direction of the images that are generated in the report. Images are generated for the Subject Area and ER Diagram reports, when you select properties under Graphical Members.
Report Designer includes the Filter By option that lets you generate drill-down reports. Some of the drill-down reports that you can generate are as follows:
Entity/Table level reports
Attribute/Column level reports
Subject Area reports:
You can use the Graphical Member option for diagrams and can view the images of diagrams.
The filters for Entity/Table and Key Group/Index are available when you select the members of a diagram or a Subject Area.
Attributes and columns can be displayed the following order:
|
Copyright © 2017 erwin Inc.
All rights reserved.
|
|